








01
Know today's estimate.
See daily hydro and gas usage translated into estimated spend using the pricing assumptions attached to each meter.
Energy intelligence for energy-intensive operations
Turn daily hydro and gas data into a view of what your operation is using and where estimated costs are heading.
Track daily usage, estimated spend, projected month-end costs, sites, and meters before invoices arrive.
Utility data coverage and market context
Available imports, supported connections, public market context, and tracked programs.
A daily operating view for finance teams and operators who cannot wait for the next billing cycle to understand energy use.
Daily usage · estimated spend · month-end direction
01
See daily hydro and gas usage translated into estimated spend using the pricing assumptions attached to each meter.
02
Follow month-to-date estimated spend and a projected month-end total as new usage arrives.
03
Bring sites and meters into one view, monitor connection status, and use alerts and briefings for the conditions you choose.
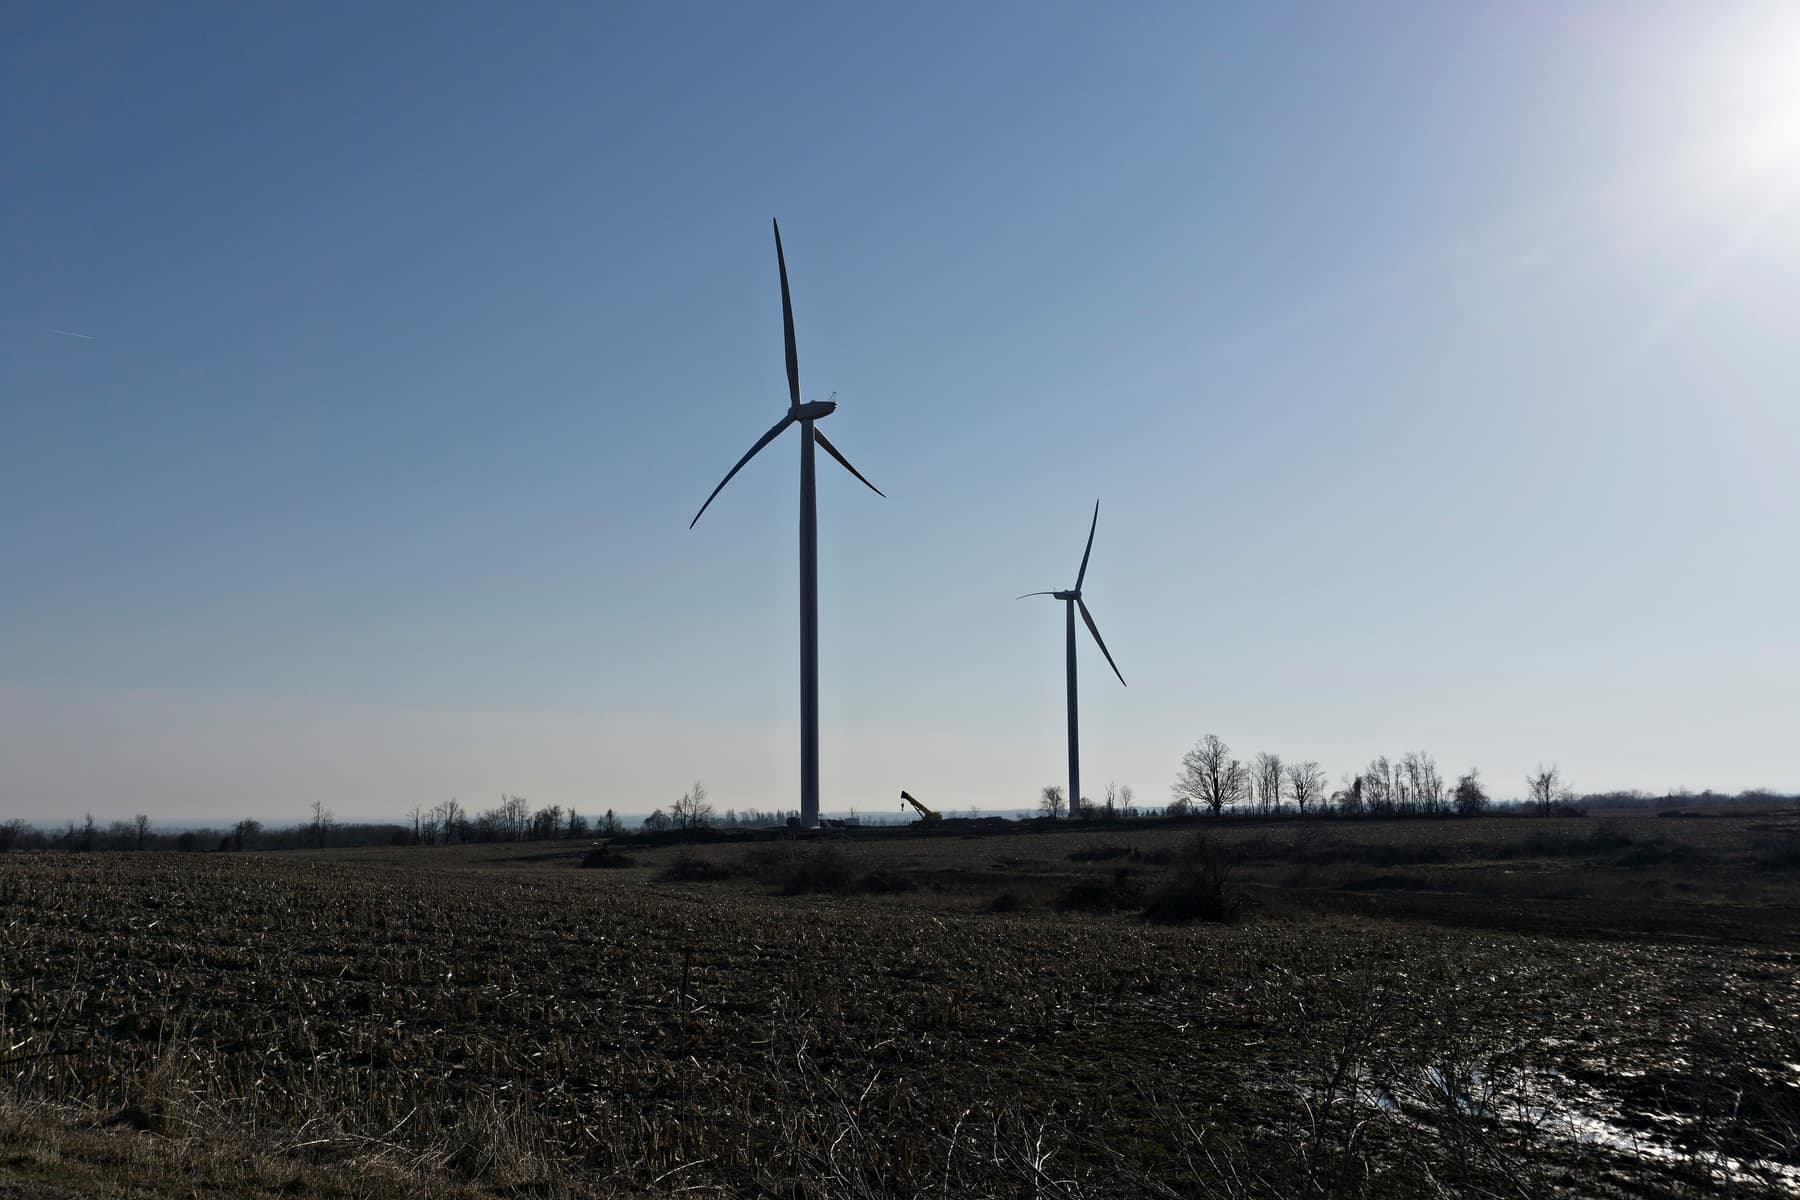
Invoices arrive after operating decisions are made. AMP brings usage and estimated cost forward, with Ontario market context where it applies.
Facility data first · public market context where applicable
Representative windows show the daily workflow. On a phone, start with Overview; on a larger screen, compare four operating views side by side.
Overview first · seven screens when useful
Daily estimated spend and projected month-end costs.
All dollar figures are estimates
Custom thresholds and day-ahead email briefings.
Usage by hour, with operating context below the totals.
Ontario demand and price context alongside facility usage.
Connected meters, their sites, commodities, and reporting status.
All dollar figures are estimates
Go deeper when useful
Each group opens on its own, so you can stop when you have the answer you need.
Daily estimates, month-end direction, commodities, and roll-ups.
Yesterday priced today, from your metered usage at the rates you signed — not six weeks later on an invoice.
A projected month-end total that moves as the month does, so the last week is a decision rather than a surprise.
Electricity and natural gas in a single stacked view, so the total is one number instead of two portals.
Whatever you connect adds into one total, and any single site or meter opens on its own.
The usage and hours underneath the estimated dollars.
kWh and cubic metres per day. When a rate changes the spend line moves and this one does not — which tells you which kind of problem you have.
Every hour of the day plotted, so an expensive hour is visible as an hour rather than buried in a monthly total.
Any series you are looking at exports as CSV, and a chart exports as PDF. If month end runs on a spreadsheet, this feeds it rather than replacing it.
Operating context layered over your own usage.
Outdoor temperature, humidity and air quality as reference layers on your own curve — the fastest way to tell a cold snap from a control problem.
Ontario demand, prices, generation, and peak context.
Province-wide demand and price drawn over your site's usage on one normalized axis, so you can see which of your hours land on top of the grid's.
Ontario's five highest-demand hours of the base period, ranked as they land, with how close the sixth is to displacing one.
Day-ahead hourly prices for the province, so tomorrow's expensive hours are known this afternoon.
Live generation by fuel — nuclear, hydro, gas, wind, solar, biofuel — behind the demand curve that sets your price.
The status of each connected meter.
Every connected meter, its commodity, its site, and when it last reported. A meter that goes quiet is the most common reason a monthly total lies.
Thresholds and briefings that reduce manual checking.
AMP reads the IESO day-ahead and pre-dispatch demand forecasts and tells you hours before a likely peak, while load can still move.
A threshold on forecast provincial demand, or a meter that stops reporting. Email or text, and then you can stop checking.
One email with tomorrow's prices and anything that moved, if you would rather read it than open a dashboard.
Connections, pricing assumptions, and team access.
Authorize your utility accounts once. No sensors, no wiring, nobody on site — and a Green Button export or a plain CSV works where there is no direct connection.
The supply and delivery rates each meter is priced with, visible rather than buried — so a figure that looks wrong can be explained.
Invite the controller who reconciles the invoice and the grower who runs the crop — they open different screens for different reasons.
Global Adjustment is the largest line on many Ontario electricity bills, and for a Class A customer it is allocated by your own demand during the province's five highest-demand hours of the base period. AMP tracks those hours, ranks them as they land, and warns you a day ahead when another one looks likely — so the hours that decide your GA are in front of you before they happen, not after the base period has closed.
That is the point of it. AMP reads the IESO day-ahead and pre-dispatch demand forecasts, and you can set an alert on either — when forecast province-wide demand crosses your threshold, you get an email or a text, hours before the hour itself. There is also a day-ahead price briefing each morning if you would rather just read it with your coffee.
The peak tracking and the warnings matter most if you are Class A, because that is whose Global Adjustment is set by those hours. If you are Class B, the daily spend, the usage behind it, and the meter and alert coverage all work exactly the same — and knowing your own peak is what tells you whether moving to Class A is worth modelling at all.
Close enough to plan against, and always labelled an estimate rather than an invoice: your metered usage, priced at the rates you enter. A real bill also carries taxes, riders, global adjustment, and true-ups, so the two will differ — plan from these numbers, pay from the bill.
Your portal shows one account, one bill, after the fact. A broker sells you a supply contract. AMP shows daily hydro and gas together, across every site, priced with the rates you already signed — while the month is still running.
Start with one meter
Bring one meter and the questions you need answered. Book time directly, or send a note and we will follow up.
Prefer email? Contact us at contact@ampenergyintelligence.com.
Photographs Boris Kasimov, CC BY 2.0. Resized and cropped.